Waaaaaaay more code than’s Jim’s solution. 
[code]Public Function CreateConvexHull(ptX() As Double, ptY() As Double) as integer()
‘Generate a convex hull to fit the given set of points
’
’ Robert Weaver, 2018-03-24
’
’ The input parameters ptX() and ptY() are arrays of the points’ x and y coordinates
’ The return value is an array containing the indices of the ptX and ptY arrays which
’ form the convex hull.
dim left,right,top,bottom As Integer
dim existsQ1,existsQ2,existsQ3,existsQ4 As Boolean = true
dim i,nPts,quad1(),quad2(),quad3(),quad4(),hull() As Integer
nPts=UBound(ptX)
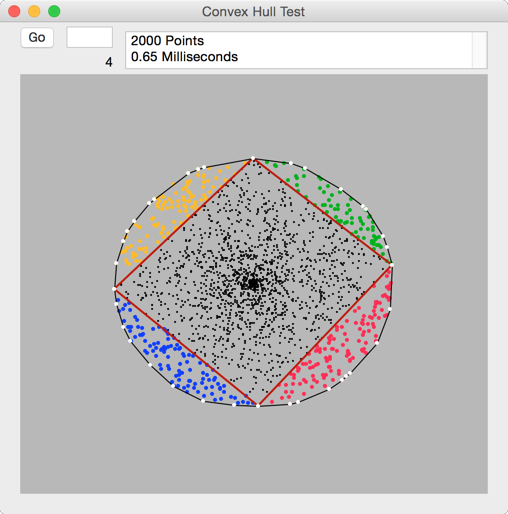
'Find leftmost, topmost, rightmost and bottommost points
'These form the initial quadrilateral hull
dim minX,maxX,minY,maxY As Double
maxX=ptX(0)
maxY=ptY(0)
minX=ptX(0)
minY=ptY(0)
for i=0 to nPts
if ptY(i)>maxY then
maxY=ptY(i)
top=i
end if
if ptX(i)>maxX then
maxX=ptX(i)
right=i
end if
if ptY(i)<minY then
minY=ptY(i)
bottom=i
end if
if ptX(i)<minX then
minX=ptX(i)
left=i
end if
next
'Assign array elements of max and min points
'to simple variables for faster calculation
dim leftX,topX,rightX,bottomX,leftY,topY,rightY,bottomY As Double
leftX=ptX(left)
leftY=ptY(left)
topX=ptX(top)
topY=ptY(top)
rightX=ptX(right)
rightY=ptY(right)
bottomX=ptX(bottom)
bottomY=ptY(bottom)
'Check for degenerate cases (triangle or line)
if topX-leftX=0 then existsQ1=False
if topX-rightX=0 then existsQ2=False
if rightX-bottomX=0 then existsQ3=False
if bottomX-leftX=0 then existsQ4=False
'Calculate slope of each line of quadrilateral
dim slopeQ1,slopeQ2,slopeQ3,slopeQ4 As Double
slopeQ1=(topY-leftY)/(topX-leftX)
slopeQ2=(rightY-topY)/(rightX-topX)
slopeQ3=(bottomY-rightY)/(bottomX-rightX)
slopeQ4=(leftY-bottomY)/(leftX-bottomX)
'Find points outside of the quadrilateral and assign to appropriate quadrant
for i=0 to nPts
if i<>left and i<>top and i<>right and i<>bottom then
if existsQ1 and ptX(i)<topX and ptY(i)>leftY and_
ptY(i)>(ptX(i)-leftX)*slopeQ1+leftY then
quad1.Append(i) 'upper left
elseif existsQ2 and ptX(i)>topX and ptY(i)>rightY and_
ptY(i)>(ptX(i)-topX)*slopeQ2+topY then
quad2.Append(i) 'upper right
elseif existsQ3 and ptX(i)>bottomX and ptY(i)<rightY and_
ptY(i)<(ptX(i)-rightX)*slopeQ3+rightY then
quad3.Append(i) 'lower right
elseif existsQ4 and ptX(i)<bottomX and ptY(i)<leftY and_
ptY(i)<(ptX(i)-bottomX)*slopeQ4+bottomY then
quad4.Append(i) 'lower left
end if
end if
next
'Process quadrant 1 outliers
if existsQ1 then
hull.Append(left) 'add left point to hull
ExpandHull(ptX,ptY,left,top,quad1,true,true,true,hull)
    hull.Append(top)
    PlotConstellation(ptX,ptY,quad1,quad2,quad3,quad4,hull,left,top,right,bottom)
    call hull.pop
end if
'Process quadrant 2 outliers
if existsQ2 then
hull.Append(top) 'add top point to hull
ExpandHull(ptY,ptX,top,right,quad2,false,true,true,hull)
end if
'Process quadrant 3 outliers
if existsQ3 then
hull.Append(right) 'add right point to hull
ExpandHull(ptX,ptY,right,bottom,quad3,false,false,false,hull)
end if
'Process quadrant 4 outliers
if existsQ4 then
hull.Append(bottom) 'add bottom point to hull
ExpandHull(ptY,ptX,bottom,left,quad4,true,false,false,hull)
end if
hull.Append(left) 'Close hull
return hull
End Function
Public Sub ExpandHull(ptA() as double, ptB() as double,p1 As Integer,_
p2 As Integer,qd() As Integer,s1 As Boolean,_
s2 As Boolean,s3 As Boolean, hull() As Integer)
dim npts as integer = UBound(qd)
if npts<0 then
'No more points to check
return
elseif npts = 0 then
'Only one point, so insert it into the edge
hull.append(qd(0))
return
else
'More than one point, so process them all
dim i,tPt,ptsCCW(-1),ptsCW(-1),maxOutlier As Integer
dim x1,x2,x3,y1,y2,y3,testDist,bestDist,slopeCW,slopeCCW As Double
'Find the point that forms the largest triangle with p1 and p2
maxOutlier=-1
bestDist=-1
for i=0 to npts
tPt=qd(i)
if tPt<>p1 and tPt<>p2 then
'Standard Pythagoras theorem to calculate distance
'from p1 to test point plus distance from test point to p2
testDist=sqrt((ptA(tPt)-ptA(p1))^2+(ptB(tPt)-ptB(p1))^2)+_
sqrt((ptA(tPt)-ptA(p2))^2+(ptB(tPt)-ptB(p2))^2)
if testDist>bestDist then
'Save the point with the greatest total distance
bestDist=testDist
maxOutlier=tPt
end if
end if
next
'Assign frequently used array elements to simple variables
x1=ptA(p1)
y1=ptB(p1)
x2=ptA(maxOutlier)
y2=ptB(maxOutlier)
x3=ptA(p2)
y3=ptB(p2)
'Calculate slope of CCW and CW line segments
slopeCW=(y2-y1)/(x2-x1)
slopeCCW=(y3-y2)/(x3-x2)
'Sort through the points to discard enclosed points and
'assign the remaining ones to either the CCW or CW edge
for i=0 to npts
tPt=qd(i)
if tPt<>p1 and tPt<>p2 and tPt<>maxOutlier then
'If neither of the following conditions apply, the point is discarded
if (ptA(tPt)<x2)=s1 and (ptB(tPt)>y1)=s2 and_
(ptB(tPt)>(ptA(tPt)-x1)*slopeCW+y1)=s3 then
'Add to CCW set
ptsCCW.Append(tPt)
elseif (ptA(tPt)>x2)=s1 and (ptB(tPt)>y2)=s2 and_
(ptB(tPt)>(ptA(tPt)-x2)*slopeCCW+y2)=s3 then
'Add to CW set
ptsCW.Append(tPt)
end if
end if
next
'Call self to expand the CCW segment
ExpandHull(ptA,ptB,p1,maxOutlier,ptsCCW,s1,s2,s3,hull)
'Add the midpoint to the hull
hull.Append(maxOutlier)
'Call self to expand the CW segment
ExpandHull(ptA,ptB,maxOutlier,p2,ptsCW,s1,s2,s3,hull)
end if
End Sub
[/code]