It’s frustrating not to have it especially since the debugger variable panel is awful to use.
My guess is that it’s not a well known feature as it has been broken for 6/7 years and I had to attach a screen recording to the case as they didn’t know what I was talking about.
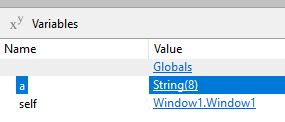
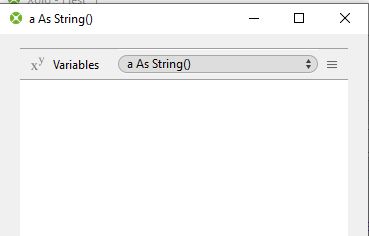
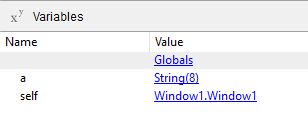
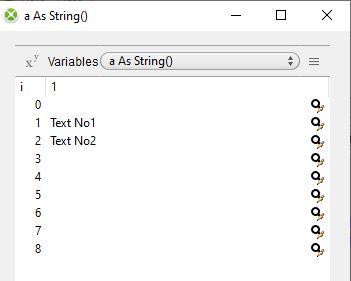
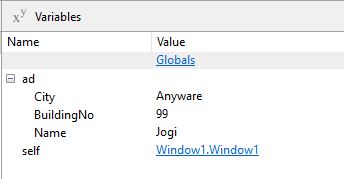
Xojo Arrays are usually shown for me, but it sometimes takes a while for the debugger to update the display and really show their content.
I found myself duplicating all kinds of macOS structure computed properties anyway with a translation to Xojo classes because the debugger some 2 or so years ago lost the ability to show structures. ;(
It’s supposed to be great that the IDE is written in Xojo, because that means that the devs who use it every day will notice all the bugs and bad design in it and fix them regardless of “points” or “rank”, because they take pride in their work and want to make a great product. Unfortunately that doesn’t seem to be the case, and a lot less pride and love and care seems to be lavished on it than went into RealStudio, which was written in C++. For example, Help Text, a wonderful feature that I (and I would think anyone who uses Xojo) use constantly, has never worked right since the day Xojo was born.
I wrote this Text via “Google Translator” because my english ist verry bad at this Time, forgive me
I think XOJO is a great development environment, the only thing that bothers me is that it takes forever to fix bugs.
I mean, of course you have to differentiate how important it is to eliminate individual errors.
If an error occurs somewhere in the program logic, I can program around it.
But if something doesn’t work in the IDE, I’m powerless.
I am surprised that the error described was not noticed by almost anyone over a period of 7 years.
I think that it would be imperative to make sure that the IDE you work with all the time works properly. But I also suspect that it is an extremely complex sensitive construct.
In short, 18 months and no fix in sight, that must not be. I can’t imagine that the developers of XOJO use the debugger when developing XOJO. At least not in a version after 2016, because then such things should have been noticed already.
So different behaviour too?
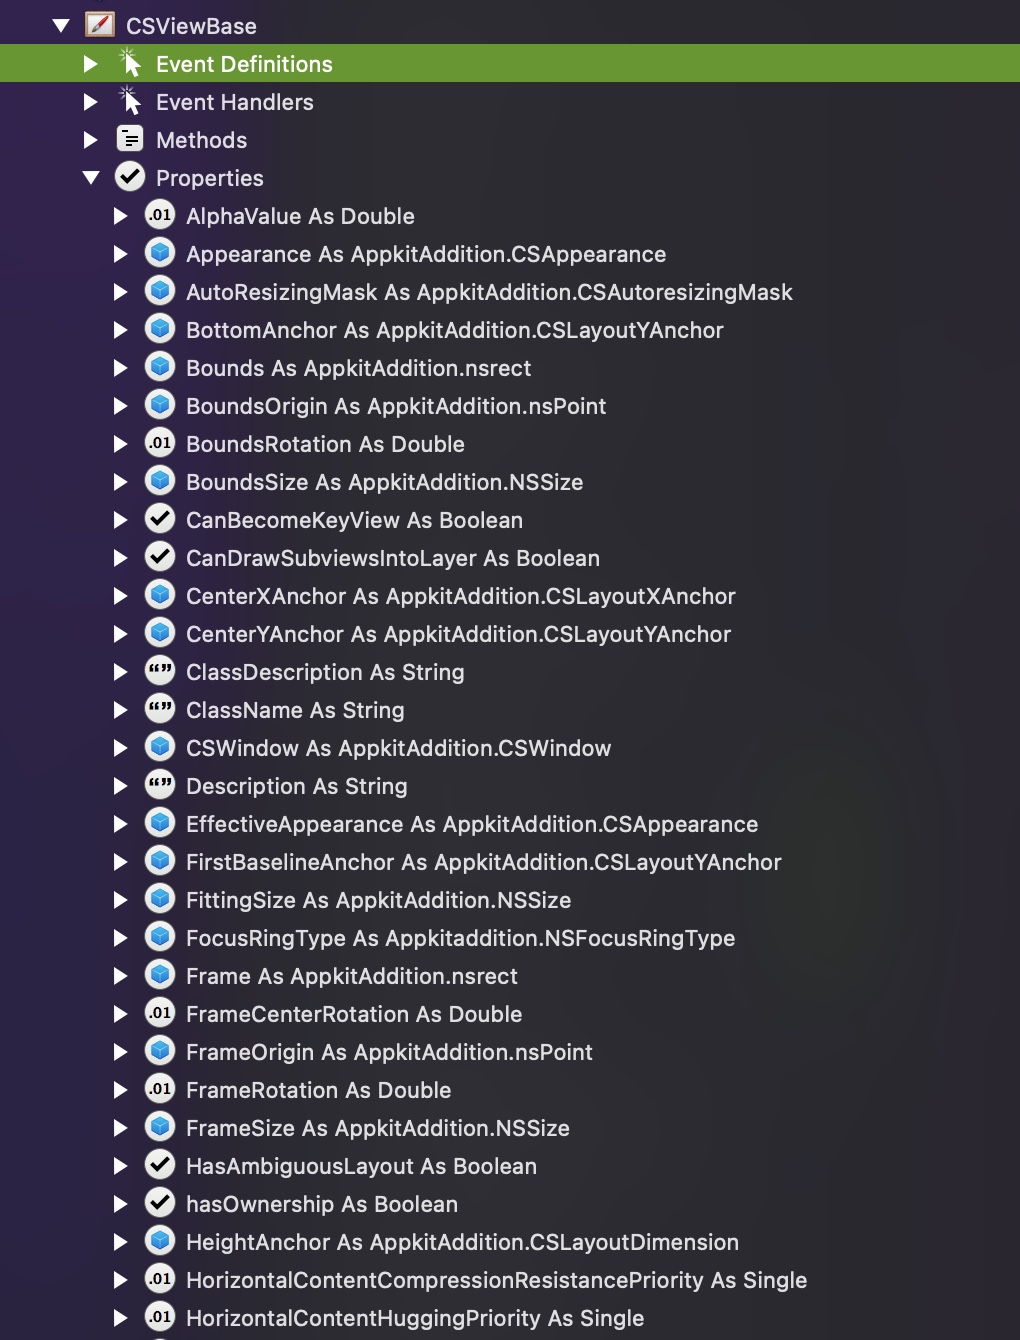
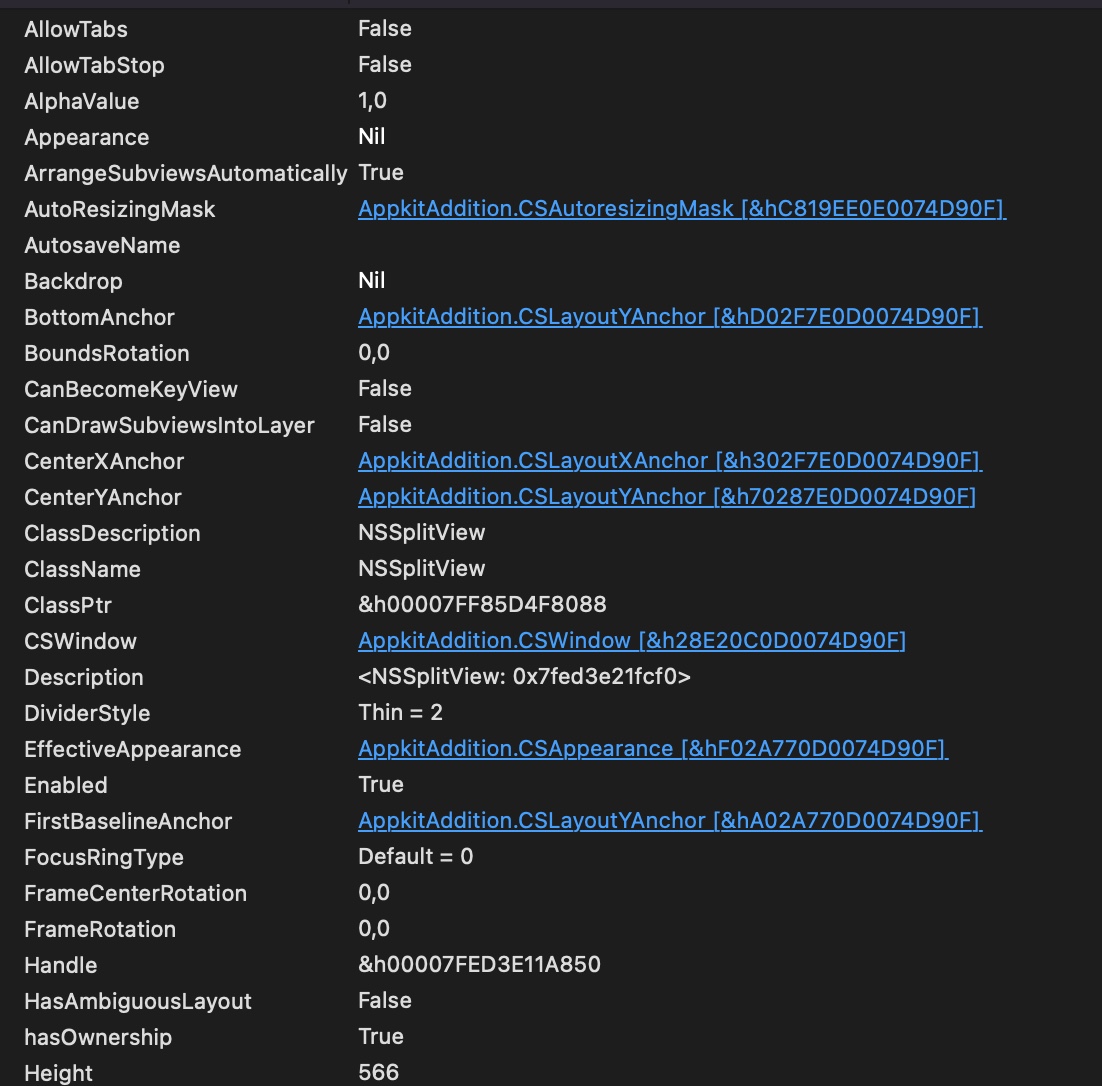
In my case please note Frame and Bounds. They don’t appear in the debugger at all. I used Xojo translations (not shown in screenshots) as additional computed properties to Rect to have them available in debugger. The same with other macOS CoreGraphics structures (NSSize, NSPoint).